Run a Taiko node
This guide will walk you through the process of operating a Taiko node via simple-taiko-node. You will be able to:
- Run a Taiko node easily from the command line on Windows, Mac, and Linux.
- View a Grafana dashboard which displays the node's status.
Prerequisites
- Docker is installed and running.
- Git is installed.
- Consult the Geth minimum hardware requirements, but ignore the storage requirement as Taiko nodes will require less storage. Around 50GB should be more than enough initially, but over time it could become insufficient as the chain grows. As of
2023-06-21T16:59:11+00:00a Taiko node sync takes 17.3 GB.
System Requirements
| Requirement | Minimum | Recommended |
|---|---|---|
| CPU | CPU with 2+ cores | Fast CPU with 4+ cores |
| RAM | 4GB RAM | 16GB+ RAM |
| Storage Space | 1TB free storage space to sync the Mainnet | High-performance SSD with at least 1TB of free space |
| Internet Speed | 8 MBit/sec download Internet service | 25+ MBit/sec download Internet service |
Instalation
- Mac/Linux
- Windows
git clone https://github.com/taikoxyz/simple-taiko-node.git
cd simple-taiko-node
git config --global core.autocrlf false
git clone https://github.com/taikoxyz/simple-taiko-node.git
cd simple-taiko-node
Configure your node (required)
To run a Grimsvotn L2 node:
cp .env.sample .env
To run a Eldfell L3 node:
cp .env.sample.l3 .env.l3
We will refer to .env.l3 as .env for the purpose of this guide.
Next, open the .env file in your preferred text editor:
- Mac/Linux
- Windows
nano .env
notepad .env
Then, configure your base layer endpoint. This would be a Sepolia L1 RPC to run a Grimsvotn L2 node, and a Grimsvotn L2 RPC to run an Eldfell L3 node.
You can get a base layer endpoint from a few places, but it must point to an archive node to access the state trie beyond the last 128 blocks.
Recommended: Run your own Sepolia archive node, see: Run a Sepolia node. This is recommended because you will eventually be rate-limited by public RPC providers. If you are running an Elfell L3 node, you will need to have a fully synced Grimsvotn L2 node.
Alternative: Alchemy and Infura are two popular RPC providers. Make sure you select the RPC as Sepolia testnet, and not Ethereum mainnet.
- Local
- Alchemy
- Infura
If you are running a local Sepolia node, you cannot reference the L1 endpoints as http://127.0.0.1:8545 and ws://127.0.0.1:8546because that is local to inside the simple-taiko-node Docker image. Depending on your firewall setup, you can do a few things. You can try:
- Using
host.docker.internalsee: Details - Using the local IP address of your machine (use something like `ip addr show` to get the IP address)
- L1_ENDPOINT_HTTP
- L1_ENDPOINT_WS

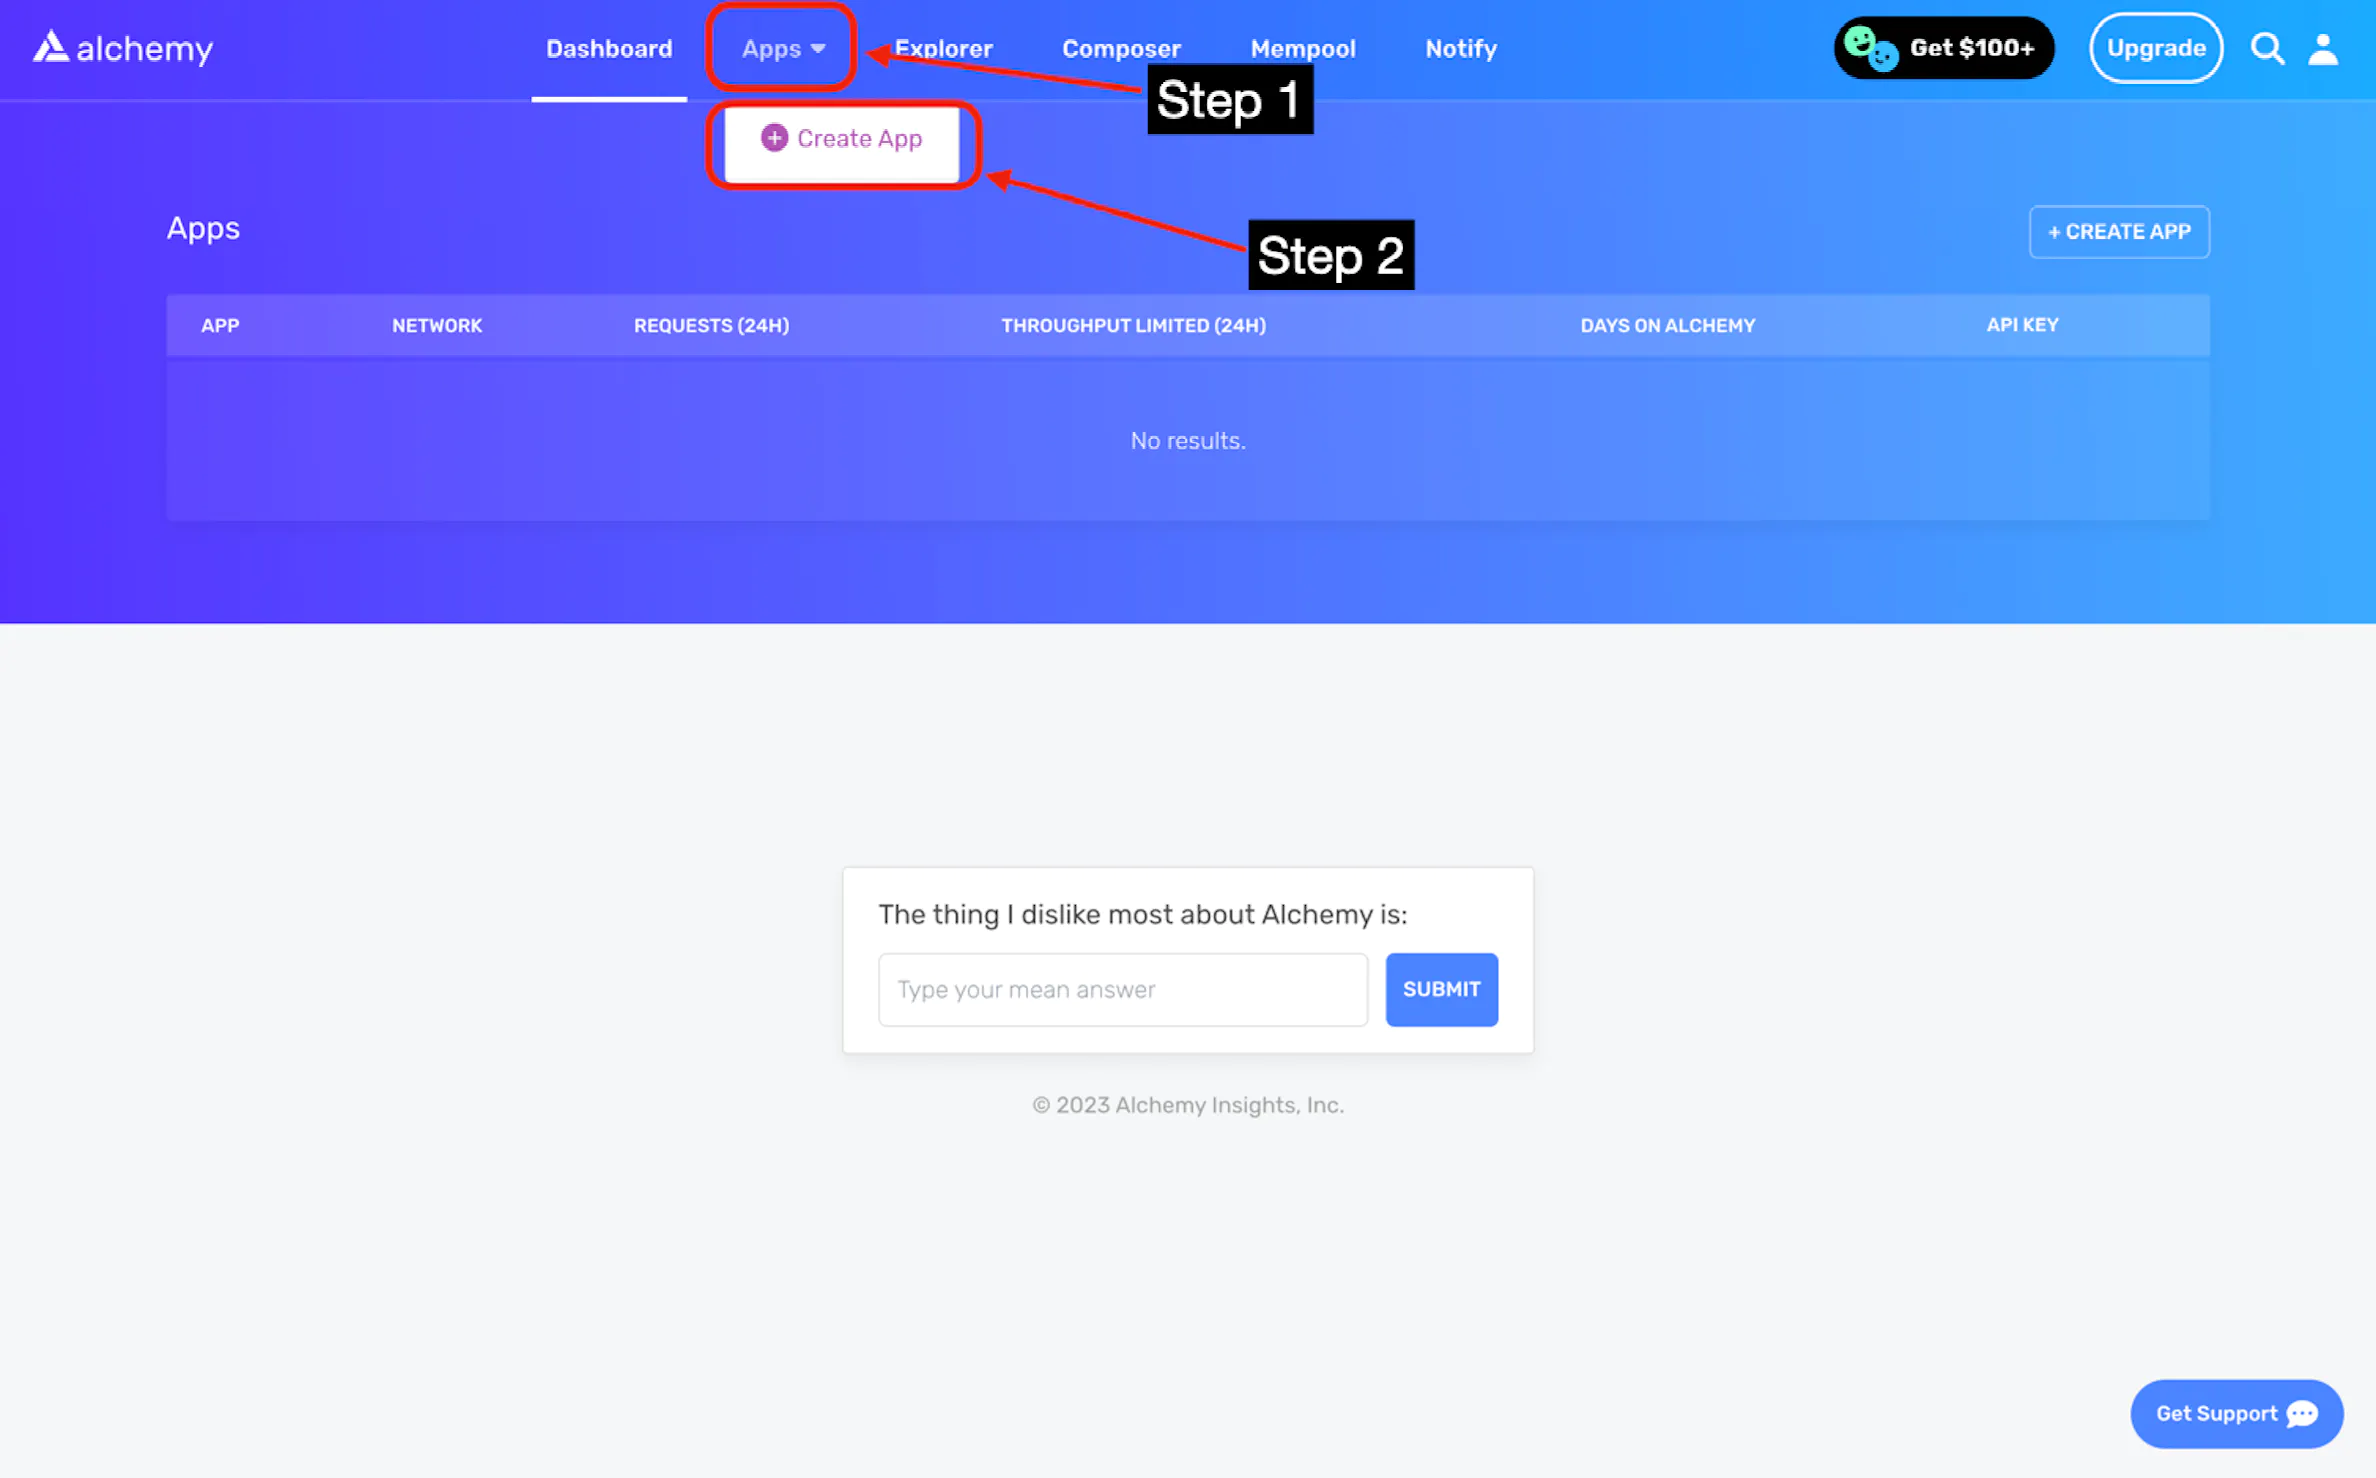
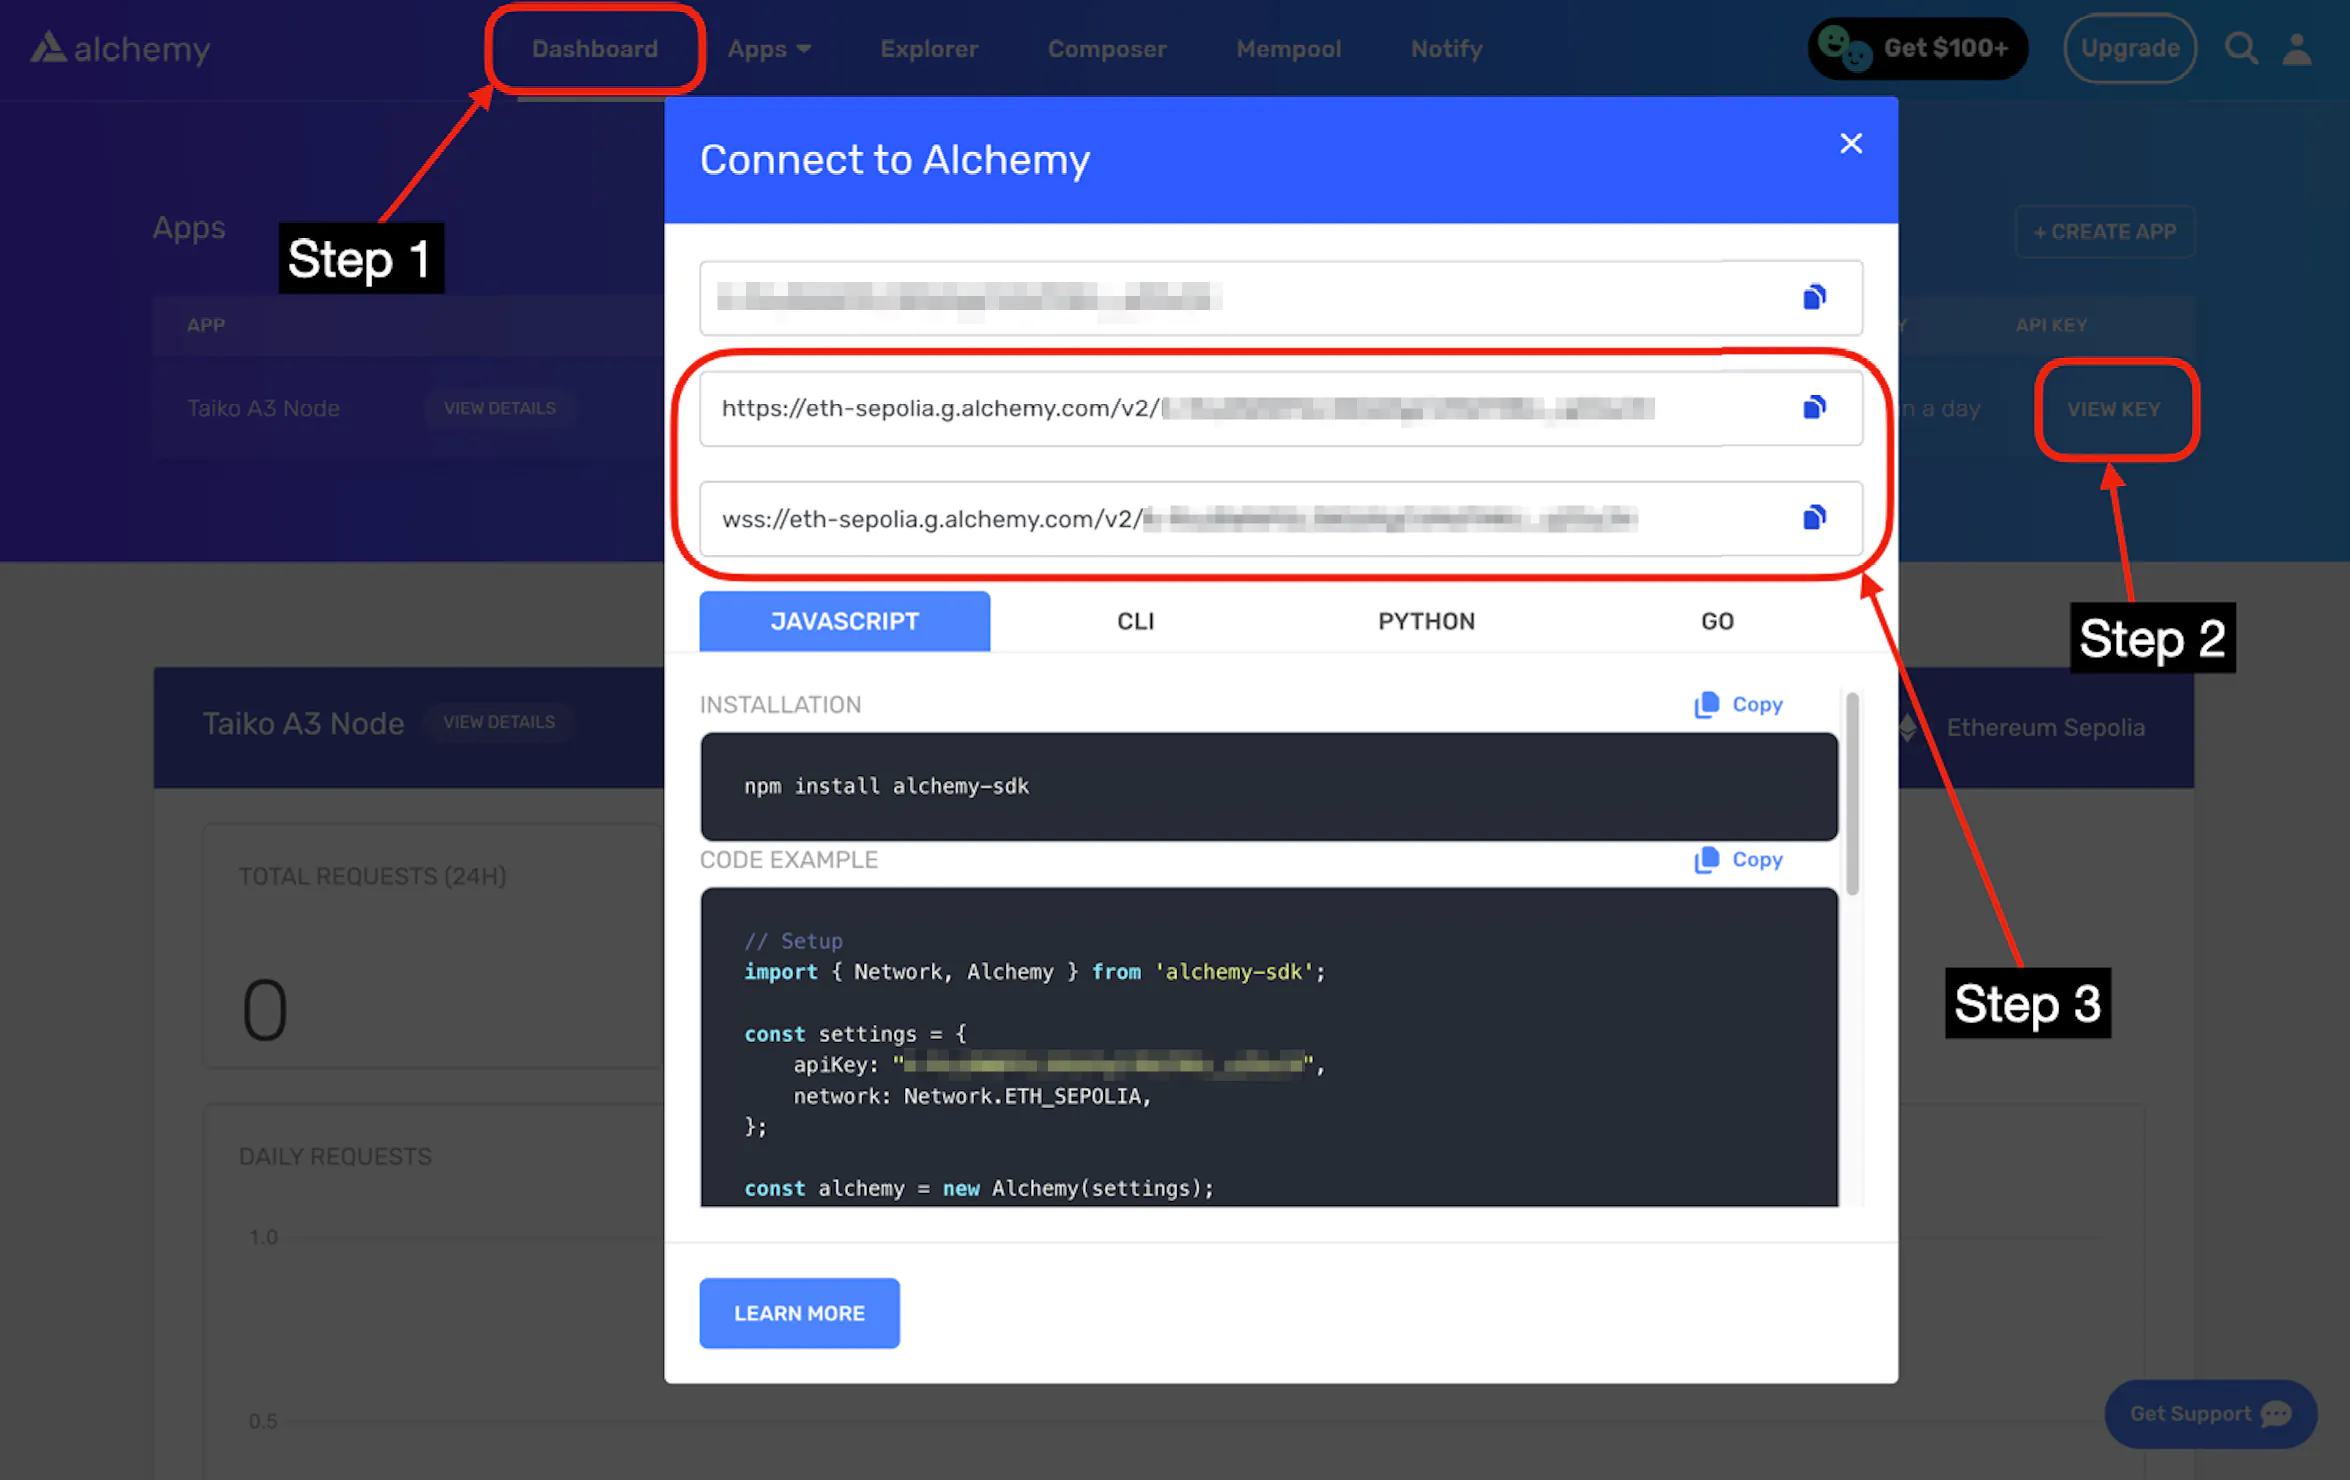
Next, configure your app:
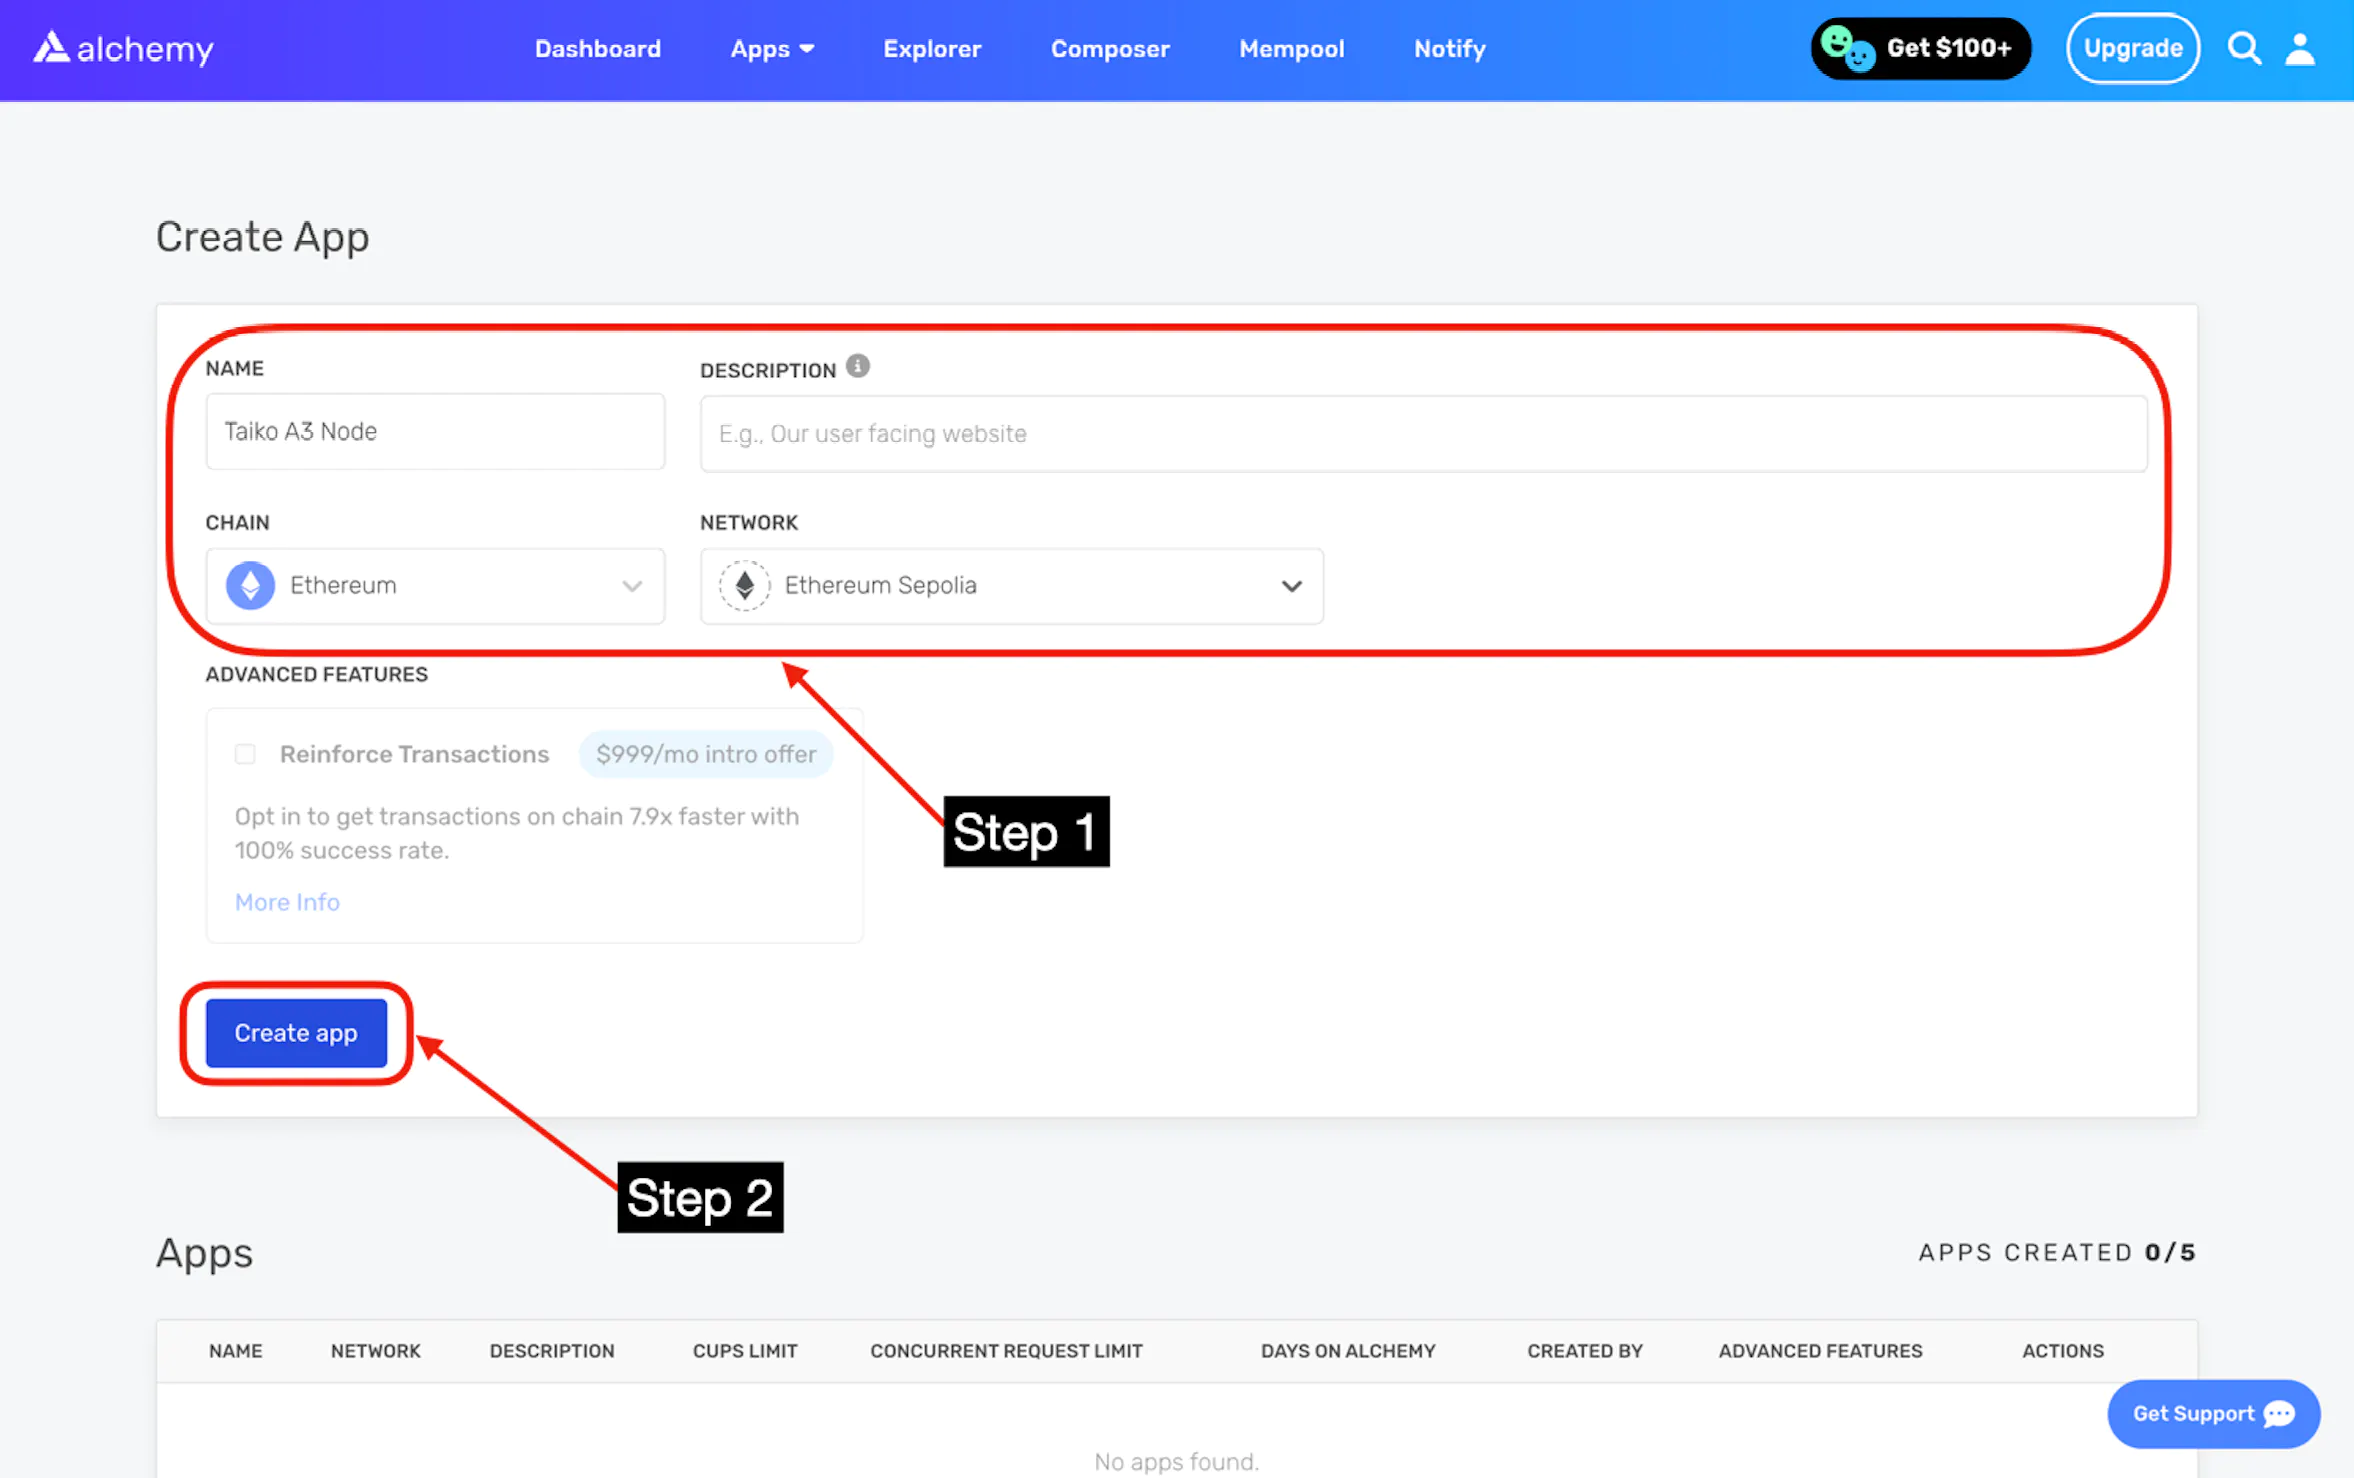
You should see https://eth-sepolia... and wss://eth-sepolia.... Copy both endpoints.
These are your L1_ENDPOINT_HTTP and L1_ENDPOINT_WS on your .env.
Next, go to "API Keys", and click the "create new API key" button:
Then, click the "create" button.
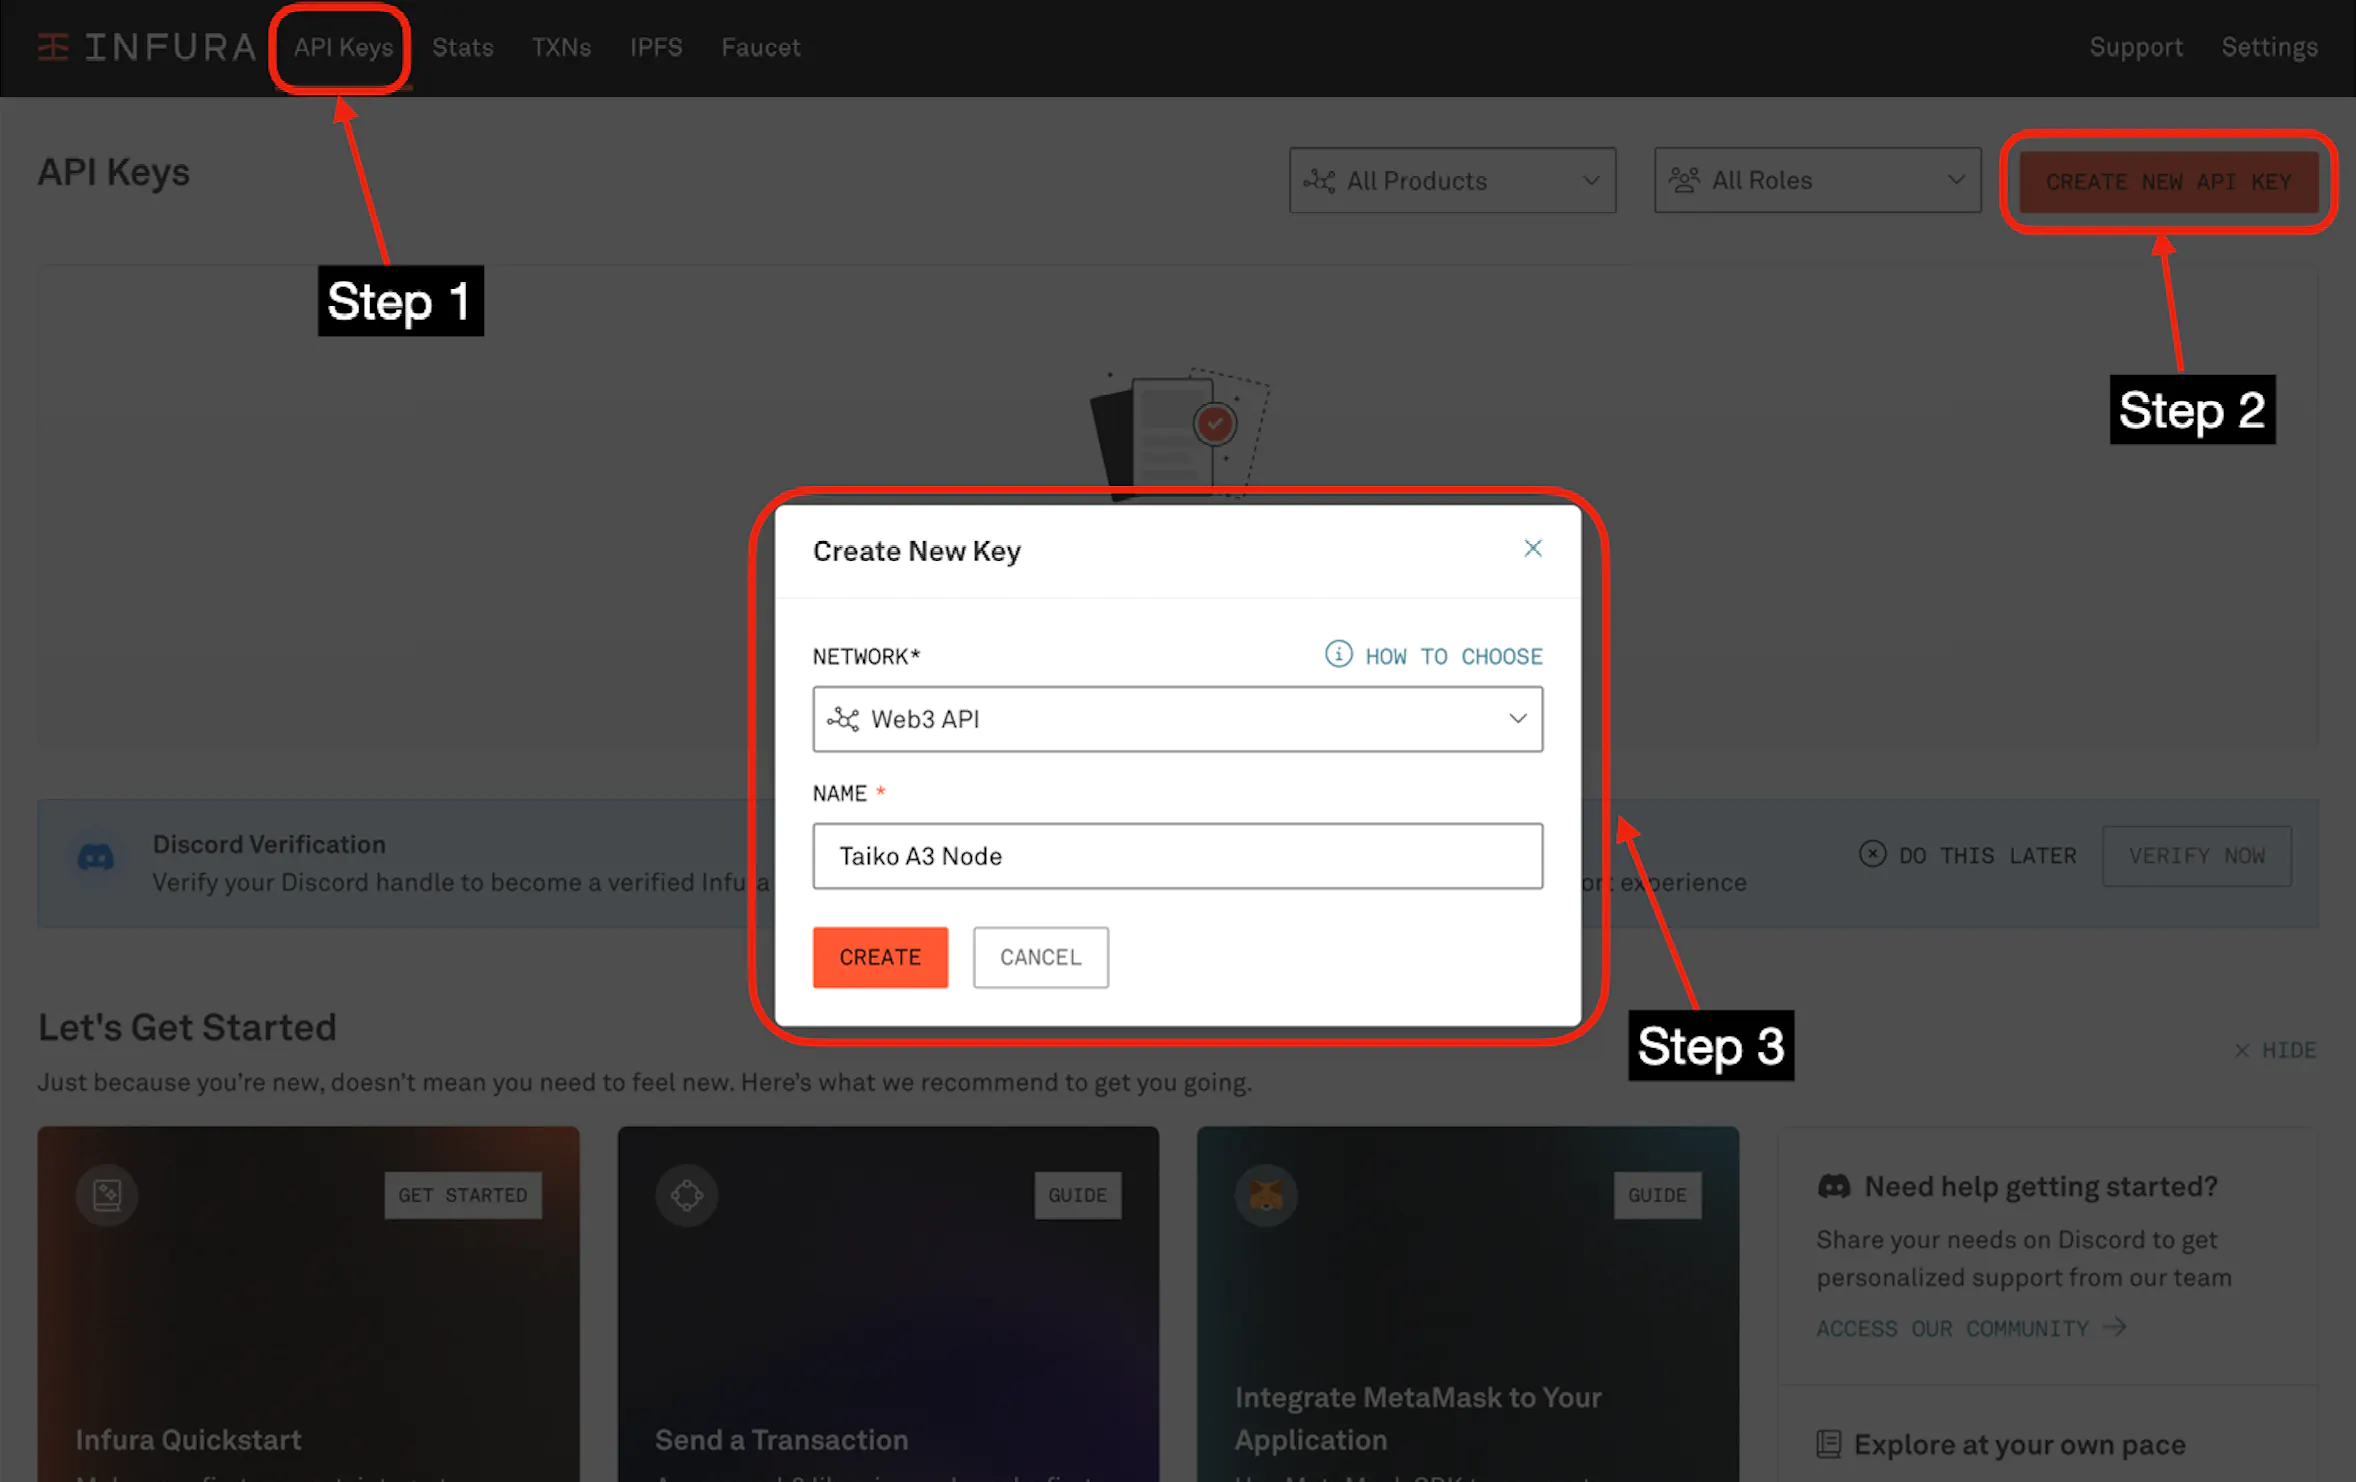
You should be redirected to your app's page.
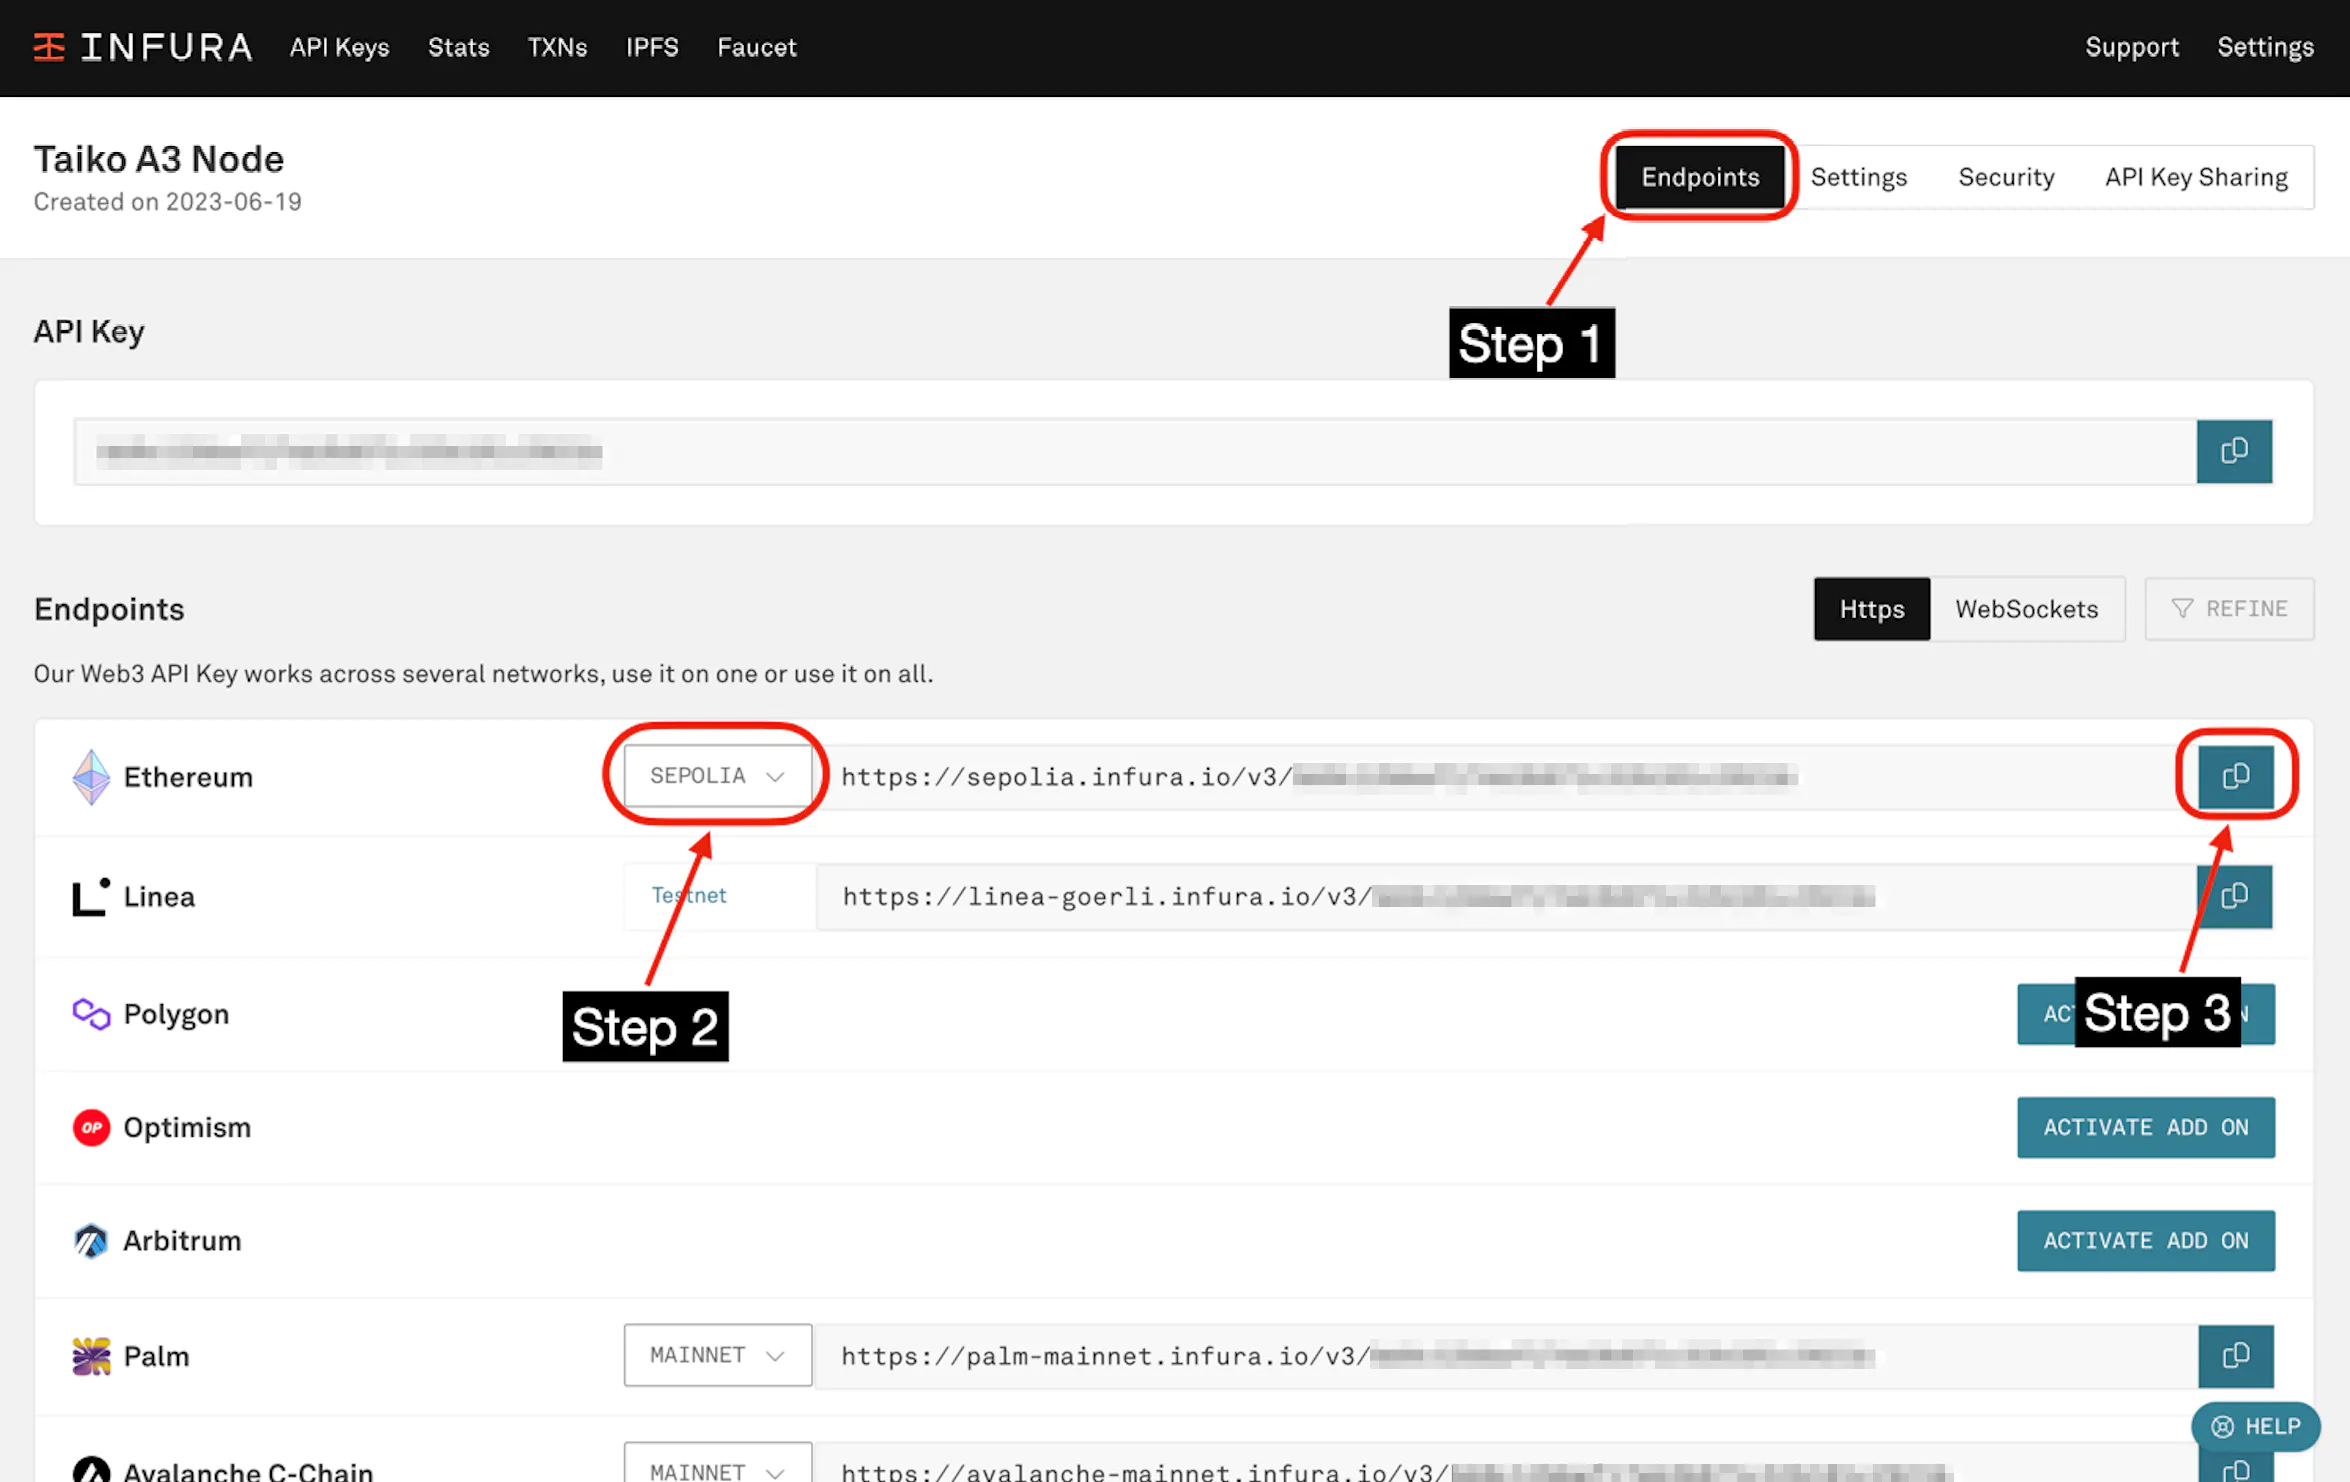
Then go to "Endpoints", and select "Sepolia". Copy the https://sepolia.infura... endpoint.
This is your L1_ENDPOINT_HTTP on your .env.
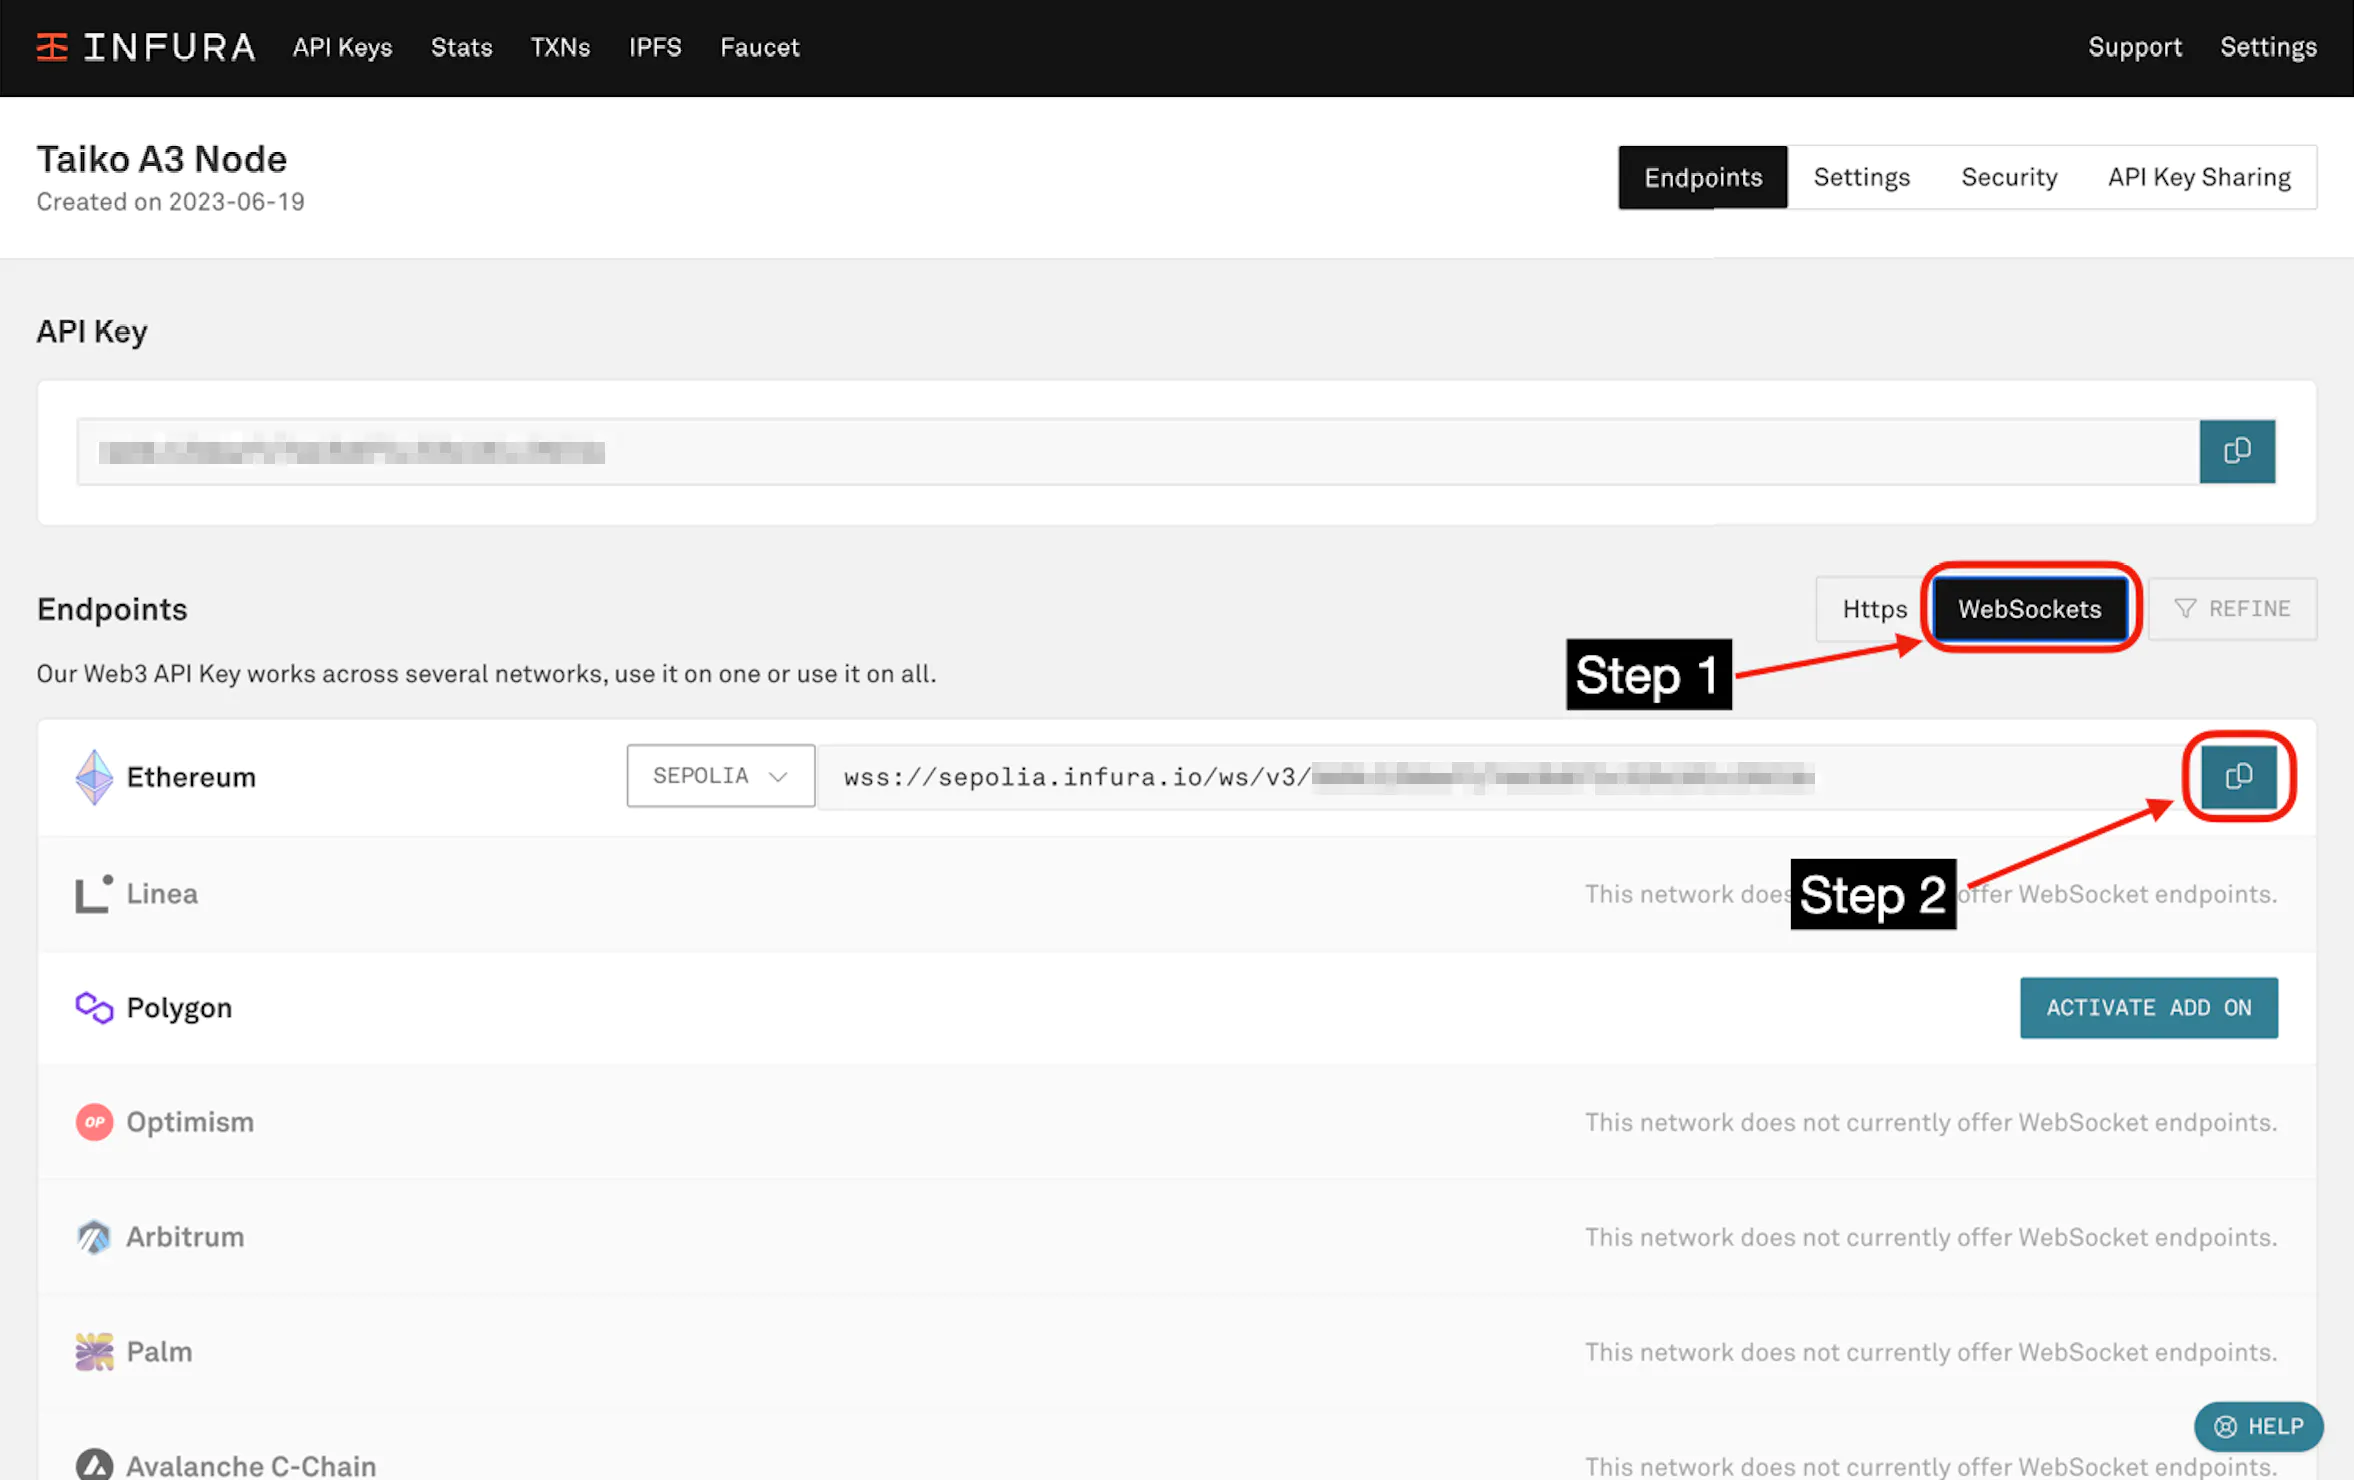
Next, go to "WebSockets", and copy the wss://sepolia.infura... endpoint.
This is your L1_ENDPOINT_WS on your .env.
Enable your node as a proposer (optional)
See enable a proposer for more information.
Enable your node as a prover (optional)
See enable a prover for more information
Start a Node
Keep in mind that for a Grimsvotn L2 node you will use docker compose for all commands,
and for an Eldfell L3 node you will use docker compose -f ./docker-compose.l3.yml --env-file .env.l3 for all commands.
Make sure Docker is running and then run the following command to start the node.
If you want to run it in the background, please add the -d flag (docker compose up -d).
For a Grimsvotn L2 node:
docker compose up
For a Eldfell L3 node:
docker compose -f ./docker-compose.l3.yml --env-file .env.l3 up
To run the node in the background (detached mode), use the -d flag:
docker compose up -d
Stop a node
This command shuts down the node, but will keep all volumes, so next time you restart the node, it won't need to synchronize from the genesis again.
docker compose down
Remove a Node
You will remove this node from your machine, do it with your own risk
These commands will completely remove the node by removing all volumes used by each container:
docker compose down -v
rm -f .env
Update a node
Update the simple-taiko-node Docker images:
docker compose pull
View the node's logs
To view the Docker logs, the following commands can be ran:
View all L2 logs
docker compose logs -f
View the L2 proposer image's logs
docker compose logs -f taiko_client_proposer
View the L2 prover image's logs
docker compose logs -f taiko_client_prover_relayer
View the L2 execution engine logs
docker compose logs -f l2_execution_engine
View all L3 logs
docker compose -f docker-compose.l3.yml logs -f
View the L3 proposer image's logs
docker compose -f docker-compose.l3.yml logs -f l3_taiko_client_proposer
View the L3 prover image's logs
docker compose -f docker-compose.l3.yml logs -f l3_taiko_client_prover_relayer
View the L3 execution engine logs
docker compose -f docker-compose.l3.yml logs -f l3_execution_engine
View the live data streams of your running containers
This shows the CPU/MEM USAGE % and consumption of your machine's resources (add prefix "docker stats -a" to display all containers)
docker stats
View the node's status dashboard
A Grafana dashboard with a Prometheus datasource is also included to display the L2 execution engine's real time status.
You can visit it at http://localhost:3000/d/L2ExecutionEngine/l2-execution-engine-overview.